 | Advanced Display Management |
| Prev | Using NeuroScope | Next |
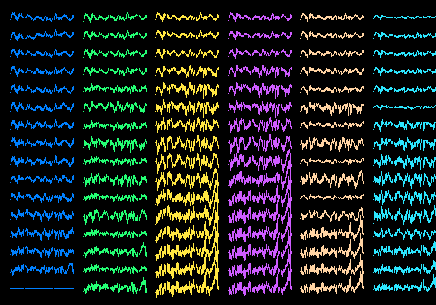
A very useful feature when recording from multisite silicon probes is the ability to display each shank as a separate 'column', so that the traces are laid out on the screen in a similar way as the physical recording sites in the brain. Select ->. Channels from each Anatomical Group now appear in separate columns.

Keep in mind that although Anatomical Groups were primarily designed to help you organize the channels to reflect the positions of the electrodes in the brain, they can be more generally used to implement any kind of classification that may suit your needs.
When channels are hidden in multiple column mode, dynamical reorganization of the display may not always be the appropriate behavior. Indeed, if you are viewing data recorded from silicon probes, you will most likely prefer keeping the channels always laid out in the same way no matter how many channels are displayed, rather than having them moved around to optimize the available space. In order to hide channels while keeping their spatial arrangement, use this trick: change the color of the channels you wish to hide to the background color (black, unless you modified it in the Settings).
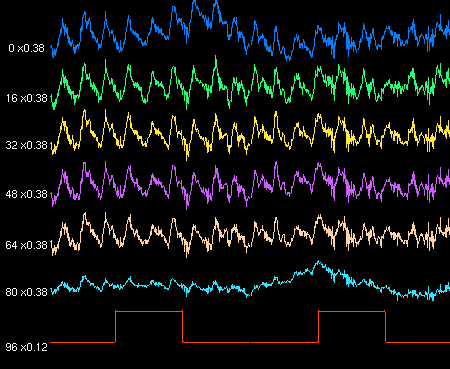
Labels provide information about the traces: the ID of the corresponding channel, and the current amplitude. Labels can be showed by selecting -> (selecting this menu item a second time will toggle its status and hide the labels).

Amplitudes are described as follows. By convention, 'x1' corresponds to the current screen gain. Thus, assuming for instance a screen gain of 1 mV/cm, an amplitude of 'x0.38' corresponds to 0.38 mV/cm. Notice that different traces can have different amplitudes, as is the case in the above screenshot where local field potentials have a gain of x0.38 and the synchronization pulse has a gain of x0.12.
Calibration bars also provide scaling information. The horizontal bar indicates the time scale, and the vertical bar indicates the voltage scale for channel 0 (notice that there is only one vertical bar, but each channel can have a different amplitude, hence the need for a convention). Showing calibration bars is most useful when printing traces. To display or hide the calibration bars, toggle ->.
Labels can be shown or hidden on a display-by-display basis, but showing or hiding calibration bars applies to all displays at once (which is why these functions appear in different menus).
Besides clicking on the corresponding circles in the palette or on the traces in the display, channels can also be selected by clicking on the corresponding labels using the Select Channel tool. For multiple selections, this offers the possibility to use the Shift key (for continuous selections) in addition to the Ctrl key (for non-continuous selections).
All the features described up to this point are most useful in the initial stages of data exploration. But once all groups are defined, the interface can be simplified by enabling only those features related to data browsing. This is know as the View Mode, as opposed to the elaborate (default) Edit Mode. You can toggle between the two modes by selecting -> or clicking on
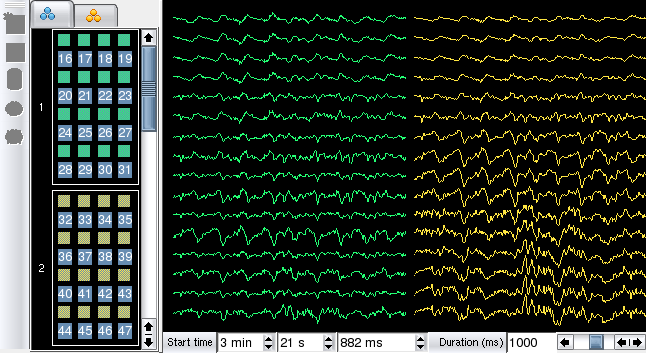
 . In View Mode, the channels are represented by colored squares in the palettes: this visual feedback allows you to instantly differentiate between modes. Channels can now be shown or hidden by simply selecting or deselecting the corresponding squares - you no longer need to explicitly show or hide them.

Notice that the editing tools are now disabled: you can no longer create, modify or delete groups, nor can you change channel offsets.
In View Mode, the palettes behave in the same way as in Klusters. This is also how the Units Palette and the Events Palette behave.
NeuroScope provides the possibility to use several displays at once, which can be useful to examine different subsets of the data in parallel. To open a new display, select ->. The new display is copied from the currently active display as a starting point, and can then be independently modified. After you have modified the contents of a display to fit your needs, you may wish to change its title (the label of the tab) to reflect your changes. Select ->. This will bring up a dialog where you can type the new title for the currently active display.
| Prev | Home | Next |
| Managing the Display | Up | Browsing Local Field Potentials |