 | Tools |
| Prev | Using NeuroScope | Next |
NeuroScope provides a set of tools to help you efficiently browse and edit your data. Whichever tool you select, when the cursor is located within the display, the time below the pointer (counted from the beginning of the data) is indicated in the Status Bar.
To zoom on a particular area in the display, select -> or click on
 . Now click on the center of the area you wish to enlarge. Alternatively, you can select the area to enlarge (click and hold the left button, then drag the mouse to select the area). Double-clicking will bring the zoom level back to the initial state.
In order to quickly assess the temporal relationships between physiological events occurring on different channels, a vertical time line can be temporarily displayed on the traces. To display the time line, select -> or click on
 . Now click and drag the mouse around in the trace view: the time line follows the cursor until you release the mouse button. In multiple column mode, the time line is drawn in each of the columns at the same position in time.
As usual, while you move the pointer within the display, the time at the cursor position is displayed in the Status Bar.
To select one or more channels directly from the display, choose -> or click on
 . Now hold the Ctrl key and click on the channels you wish to select. As a visual feedback, the traces become slightly thicker when the channels are selected. Notice that this does not allow for continuous selection. Use this method instead.
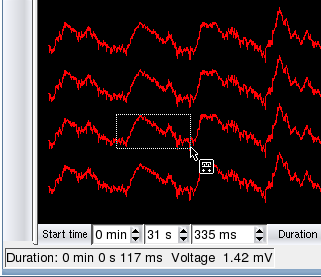
To measure on the traces the amplitude and duration of a neurophysiological event (an action potential, a theta cylce, etc.), select -> or click on
 . Click on the upper left corner of the rectangular region you wish to measure, and drag the pointer to the lower right corner: the corresponding voltage and duration are indicated in the Status Bar.

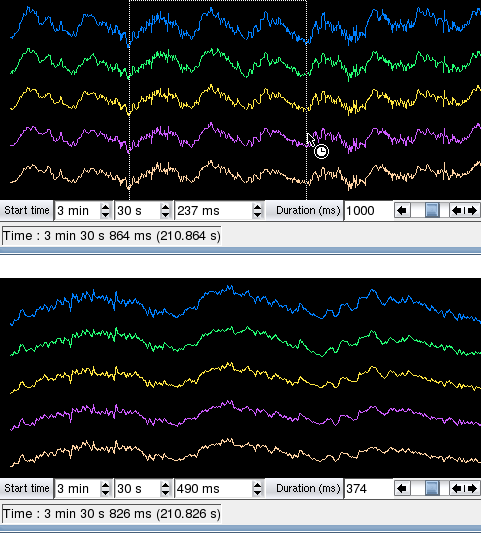
To graphically refine the displayed time window, select -> or click on
 . Click at the start time of the window you wish to define, then drag the pointer to the end time: the displayed time window will be updated accordingly. Notice that this is different from zooming in two respects: first, only the horizontal component of the selection (time) is taken into account, and second this actually redefines both the Start time and the Duration, rather than temporarily focusing on a particular portion of the display.

As usual, while you move the pointer within the display, the time at the cursor position is displayed in the Status Bar.
To select a single event, choose -> or click on
 , and click on the event line in the display. The event can now be moved or deleted. For more details, see Events.
To add a single event to an existing event file, select an event type under -> or click on
 , optionally selecting an event type in the drop down menu, and click in the display where the new event should be added. For more details, see Events.
| Prev | Home | Next |
| Browsing Local Field Potentials | Up | Unit Activity |